

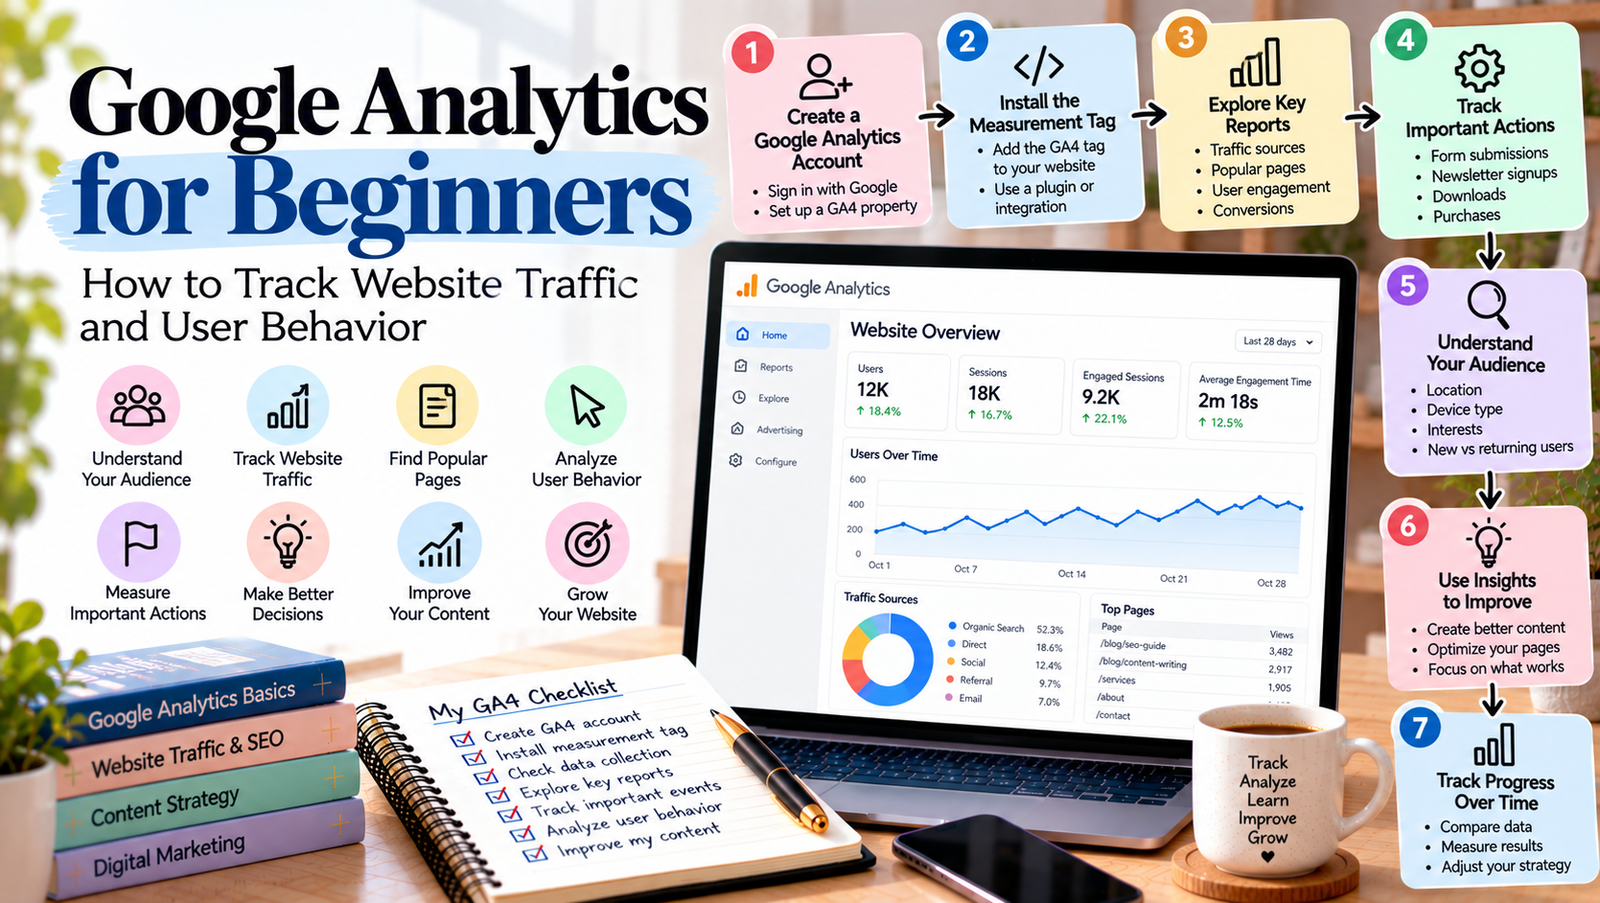
Running a website without tracking its performance is like running a business without checking how it is doing. You may publish useful articles, improve your website, and share content on social media, but you still need to know what is working.
Google Analytics for beginners provides a starting point for understanding website traffic and visitor behavior. It helps you learn how people find your website, which pages they visit, and how they interact with your content.
For bloggers, freelancers, and small business owners, this information can guide better decisions. Instead of guessing which topics attract readers, you can use data to identify useful opportunities.
In this guide, you will learn what Google Analytics is, how it works, which reports matter, and how to use the information to improve your website.
What Is Google Analytics?
Google Analytics is a free web analytics platform that helps website owners measure traffic and user interactions. Its current standard version, Google Analytics 4 (GA4), uses an event-based measurement model.
In simple terms, it records activities on your website, such as page views, clicks on certain tracked elements, and other interactions when the relevant measurement is configured.
For example, if you publish a blog post about SEO, Google Analytics can help you understand how many users visited the page and whether they continued exploring your website.
You can also examine engagement and track specific actions, such as form submissions or purchases, when those events are configured correctly.
Google Analytics does not automatically explain every reason behind a visitor’s behavior. However, it provides useful information to help you investigate what is happening.
Why Is Google Analytics Important for Your Website?
Google Analytics can help you make informed decisions instead of relying only on assumptions.
Here are some important benefits.
1. Understand Where Your Visitors Come From
Visitors may reach your website through organic search, social media, referral links, email campaigns, or direct visits.
Understanding these channels helps you identify which sources bring people to your website.
For example, you may discover that search engines bring visitors to your educational articles, while social media attracts people to your portfolio. This information can help you plan your future content and promotion.
2. Identify Your Most Popular Pages
Some pages attract more visitors than others. Google Analytics can help you identify which articles, landing pages, and other content receive attention.
You can use these insights to find topics worth expanding, add relevant internal links, and improve pages that support your website goals.
However, a page with more traffic is not always more valuable. A smaller page that generates enquiries or subscriptions may contribute more to your goals.
3. Understand Visitor Engagement
Traffic numbers alone do not tell the whole story. You also need to understand whether visitors interact with your content.
GA4 provides engagement-related measurements and reports that can help you investigate visitor activity.
For example, if a blog post receives visitors but generates little further interaction, you might review its introduction, readability, page layout, and links to related content.
4. Measure Important Actions
If your website aims to generate enquiries, subscriptions, downloads, or sales, you can configure events to measure these actions.
Once the relevant events and reporting are set up correctly, you can see whether your website supports your business goals.
This makes it easier to evaluate more than just page views.
How Does Google Analytics Work?
Google Analytics generally collects website interaction data through a measurement tag or an appropriate integration.
After you create a GA4 property and install its measurement code, the platform can collect configured events when visitors use your website. The data then appears in reports, although processing times can vary.
The basic process looks like this:
- Create a Google Analytics account.
- Set up a GA4 property for your website.
- Add the measurement tag or use a supported integration.
- Test that data is being collected.
- Review reports to understand website activity.
The exact setup depends on your website platform and configuration.
Remember that data collection must follow applicable privacy requirements. Configure consent and tracking appropriately for your visitors and location.
For detailed instructions, visit the official Google Analytics documentation.
Important Google Analytics Metrics for Beginners
Google Analytics contains many reports and measurements. You do not need to learn everything at once. Start with the metrics that answer your most important questions.
1. Users
Users represent people or user identities measured by Google Analytics according to its reporting definitions and settings.
This metric helps you understand how many users interacted with your website during a selected period.
Keep in mind that analytics measurements do not always equal the exact number of individual people. Devices, browsers, consent settings, and measurement limitations can affect the results.
2. Sessions
A session represents a group of interactions that take place during a visit to your website, according to GA4’s session rules.
Sessions help you understand how often visits occur.
For example, one person may visit your website on Monday and return on Thursday. These visits can contribute to separate sessions.
3. Views
Views measure page or screen views recorded by Google Analytics. This metric helps you understand how frequently visitors view your content.
Compare views across relevant pages to identify popular topics and pages that may need improvement.
4. Engagement Rate
Engagement rate measures the percentage of sessions that qualify as engaged sessions under GA4’s rules.
It can help you investigate whether visitors are interacting with your website in meaningful ways.
Do not judge a page using this metric alone. A visitor may find a quick answer and leave satisfied, while another page may require more interaction before a visitor completes a task.
5. Conversions and Key Events
GA4 lets you identify important events as key events for reporting purposes. Depending on your configuration, these may include newsletter signups, lead submissions, or purchases.
Tracking these actions helps you understand whether visitors are completing meaningful tasks.
Choose events that match your actual website goals instead of tracking every possible interaction without a clear purpose.
How to Read Google Analytics Reports
When you open Google Analytics, begin with a specific question. This makes it easier to choose the right report.
Traffic Acquisition Report
The Traffic acquisition report helps you understand how sessions arrive through different traffic sources and channels.
You can use it to investigate whether visitors come from organic search, social media, referral links, email, or other channels.
For example, if organic search contributes a growing share of sessions, you can examine which landing pages and topics are associated with that growth.
Pages and Screens Report
The Pages and screens report helps you examine which pages receive views and how users interact with your content.
Use it to identify popular articles, pages that deserve updates, and content that could link readers to related resources.
You can also compare performance over time rather than relying on a single day’s results.
Engagement Reports
Engagement reports help you explore activity such as views, events, and other engagement measurements available in your property.
Review these reports to understand which pages attract attention and which actions visitors take.
Realtime Report
The Realtime report shows recent activity as it is recorded by your property. It can be especially helpful when testing a new setup or checking whether a recent interaction is being collected.
However, realtime activity is not a substitute for longer-term reporting. Use reports covering suitable date ranges to understand broader trends.
How to Use Google Analytics to Improve Your Website
Collecting data is only the first step. The real value comes from using it to make improvements.
Step 1: Choose a Clear Website Goal
Decide what you want your website to achieve.
Your goal might be to attract organic visitors, increase newsletter subscriptions, generate freelance enquiries, or encourage readers to explore more articles.
A clear goal helps you decide which measurements matter.
Step 2: Review Your Traffic Sources
Examine the channels bringing visitors to your website.
If organic search is important, combine analytics data with Google Search Console to investigate search impressions, clicks, and search queries.
If social media is a major source, review which campaigns or links bring visitors who engage with your content.
Remember that different tools measure different parts of the visitor journey. Their numbers may not match exactly.
Step 3: Identify Pages Worth Improving
Look for pages that attract traffic but do not appear to support your goal.
For example, a popular article might receive many views but provide few clear paths to related content. Adding relevant internal links and a useful next step may improve the visitor experience.
You can also update outdated information, improve readability, and make important resources easier to find.
Step 4: Track Important Actions
Configure relevant events for actions such as contact form submissions, newsletter signups, or purchases.
Test the setup to make sure the events are recorded correctly. Avoid treating an event as a successful conversion until you have verified what it measures.
Step 5: Compare Results Over Time
Website performance changes with seasonality, publishing activity, campaigns, and search demand.
Compare suitable periods and look for patterns rather than reacting to every daily fluctuation.
When you make a change, record what you changed and review its results after enough data has accumulated.
Common Google Analytics Mistakes to Avoid
Beginners can make several mistakes when interpreting analytics data.
- Focusing only on traffic: More visitors do not automatically mean more subscribers, enquiries, or sales.
- Ignoring tracking setup: Incorrect tags or events can lead to incomplete or misleading reports.
- Comparing different periods carelessly: Seasonality and campaign timing can affect results.
- Making decisions from small data samples: Limited data may not reveal a reliable pattern.
- Ignoring privacy requirements: Tracking must be configured responsibly and in line with applicable rules.
- Treating every metric as equally important: Focus on measurements that support your website goals.
Use analytics as a guide for investigation, not as a replacement for understanding your audience.
Google Analytics for beginners does not have to feel complicated. Start by understanding users, sessions, views, engagement, and the traffic sources bringing visitors to your website.
Next, learn to read the reports that match your goals. Use the information to improve your content, strengthen your website structure, and measure meaningful actions.
Most importantly, review your results regularly and make changes based on evidence. With consistent practice, Google Analytics can help you understand your audience and make better decisions about your website’s growth.
[…] For more guidance, read Google Analytics for Beginners. […]